1N821 데이터 시트보기 (PDF) - Motorola => Freescale
부품명
상세내역
제조사
1N821 Datasheet PDF : 4 Pages
| |||
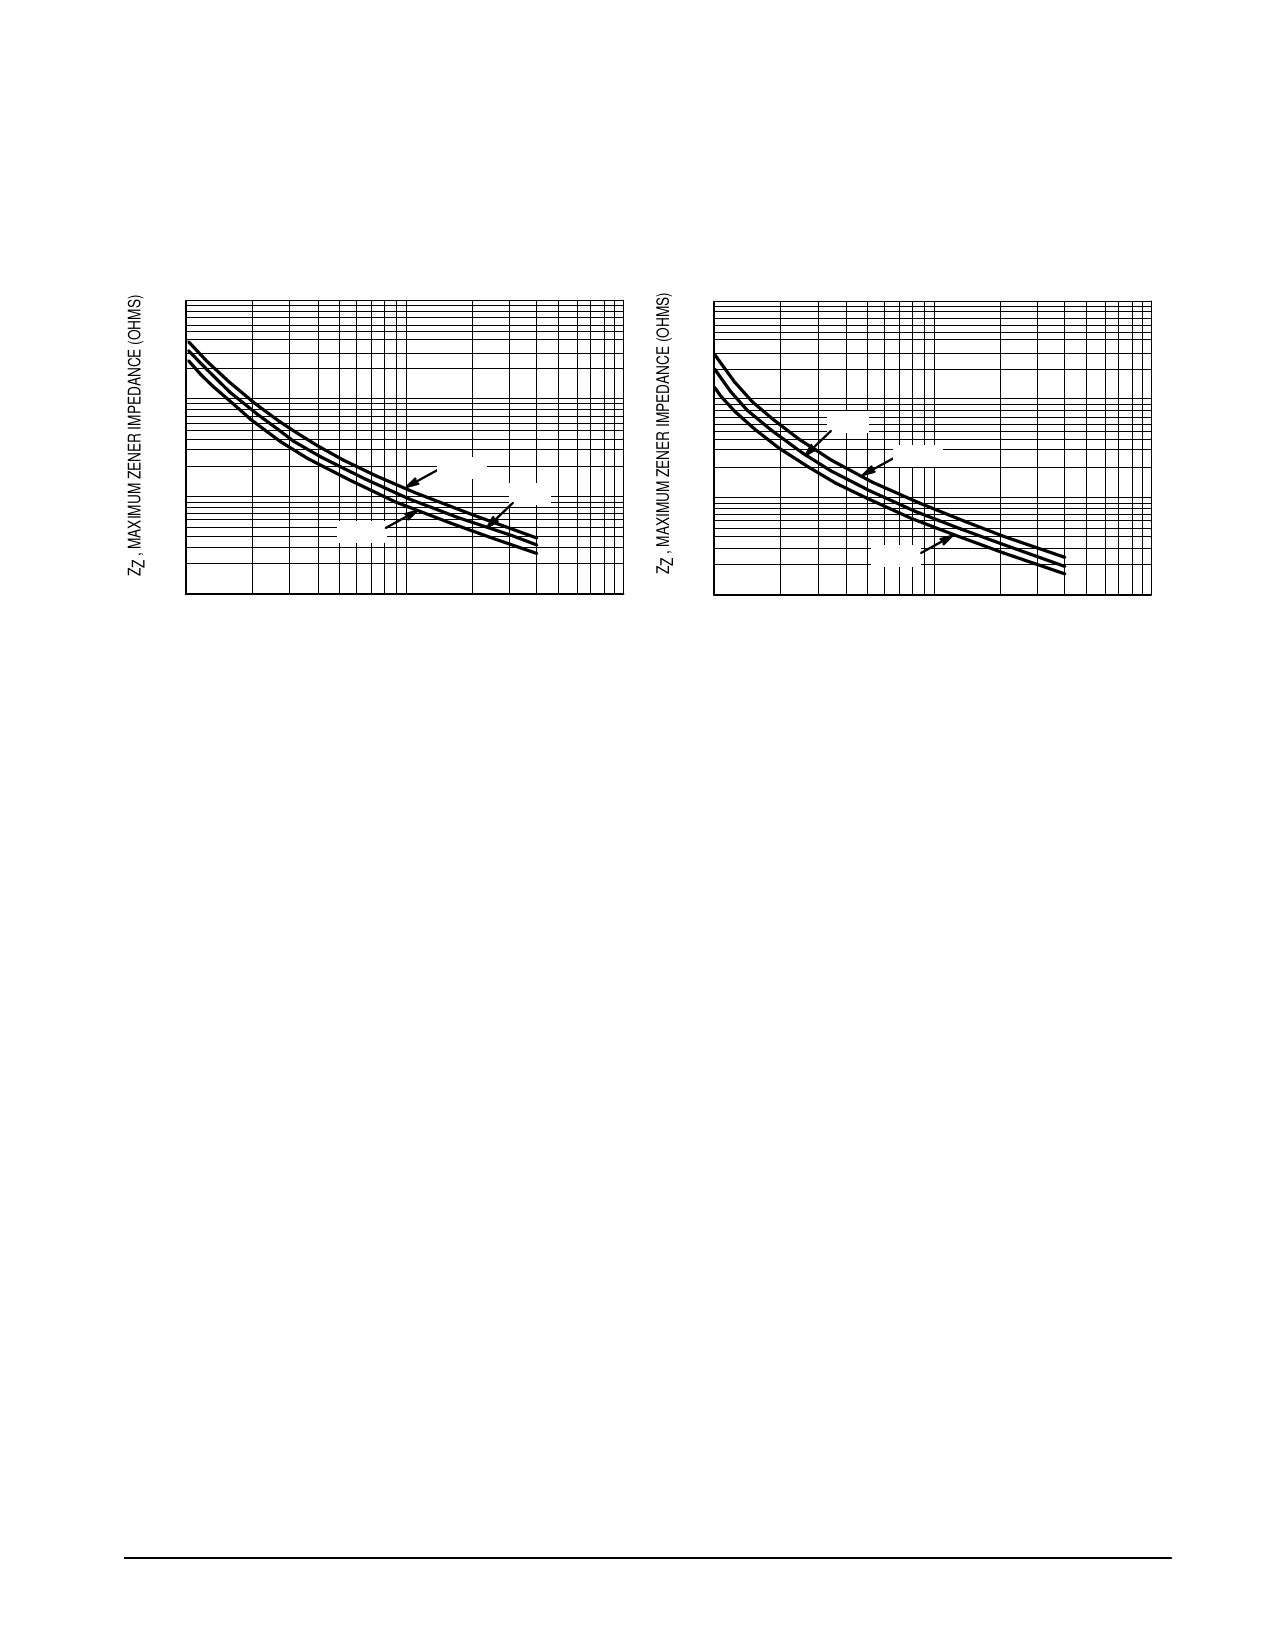
1N821,A 1N823,A 1N825,A 1N827,A 1N829,A
MAXIMUM ZENER IMPEDANCE versus ZENER CURRENT
(See Note 2)
MORE THAN 95% OF THE UNITS ARE IN THE RANGES INDICATED BY THE CURVES.
1000
800
600
400
200
100
80
60
40
20
10
8
6
4
2
1
1
1000
800
600
400
200
100
80
60
40
100°C
20
25°C
10
8
–55°C
6
4
2
1
2
4 6 8 10
20
40 60 80 100
1
IZ, ZENER CURRENT (mA)
Figure 4. 1N821 Series
25°C
100°C
–55°C
2
4 6 8 10
20
40 60 80 100
IZ, ZENER CURRENT (mA)
Figure 5. 1N821A Series
NOTE 1. VOLTAGE VARIATION (∆VZ) AND TEMPERATURE COEFFICIENT
All reference diodes are characterized by the “box method.” This guarantees a maximum volt-
age variation (∆VZ) over the specified temperature range, at the specified test current (IZT),
verified by tests at indicated temperature points within the range. VZ is measured and re-
corded at each temperature specified. The ∆VZ between the highest and lowest values must
not exceed the maximum ∆VZ given. This method of indicating voltage stability is now used
for JEDEC registration as well as for military qualification. The former method of indicating
voltage stability — by means of temperature coefficient accurately reflects the voltage devi-
ation at the temperature extremes, but is not necessarily accurate within the temperature
range because reference diodes have a nonlinear temperature relationship. The temperature
coefficient, therefore, is given only as a reference.
NOTE 2.
The dynamic zener impedance, ZZT, is derived from the 60 Hz ac voltage drop which results
when an ac current with an rms value equal to 10% of the dc zener current, IZT, is superim-
posed on IZT. Curves showing the variation of zener impedance with zener current for each
series are given in Figures 4 and 5.
NOTE 3.
These graphs can be used to determine the maximum voltage change of any device in the
series over any specific temperature range. For example, a temperature change from 0 to
+50°C will cause a voltage change no greater than +31 mV or – 31 mV for 1N821 or 1N821A,
as illustrated by the dashed lines in Figure 1. The boundaries given are maximum values. For
greater resolution, an expanded view of the center area in Figure 1a is shown in Figure 1b.
NOTE 4.
The maximum voltage change, ∆VZ, Figures 2 and 3 is due entirely to the impedance of the
device. If both temperature and IZT are varied, then the total voltage change may be obtained
by graphically adding ∆VZ in Figure 2 or 3 to the ∆VZ in Figure 1 for the device under consider-
ation. If the device is to be operated at some stable current other than the specified test cur-
rent, a new set of characteristics may be plotted by superimposing the data in Figure 2 or 3
on Figure 1. For a more detailed explanation see application note in later section.
NOTE 5.
Zener voltage limits at 25°C measured with the test current (IZT) applied with the device junc-
tion in thermal equilibrium at an ambient temperature of 25°C.
Motorola TVS/Zener Device Data
6.2 Volt OTC 400 mW DO-35 Data Sheet
8-161
Share Link: 