MAX785 데이터 시트보기 (PDF) - Maxim Integrated
부품명
상세내역
제조사
MAX785 Datasheet PDF : 24 Pages
| |||
Product Reliability Report
processes with extremely tight control. Each wafer
must pass numerous in-process checkpoints (such
as oxide thickness, alignment, critical dimensions,
and defect densities), and must comply with Maxim’s
demanding electrical and physical specifications.
Finished wafers are inspected optically to detect any
physical defects. They are then parametrically tested
to ensure full conformity to Maxim’s specifications.
Our parametric measurement system is designed to
make the precision measurements that will ensure
reliability and reproducibility in analog circuits.
We believe our quality-control technology is the best
in the industry, capable of resolving current levels
below 1pA, and of producing less than 1pF capaci-
tance. Maxim’s proprietary software allows automatic
measurement of subthreshold characteristics, fast
surface-state density, noise, and other parameters
crucial to predicting long-term stability and reliability.
Every Maxim wafer is subject to this rigorous screen-
ing at no premium to our customers.
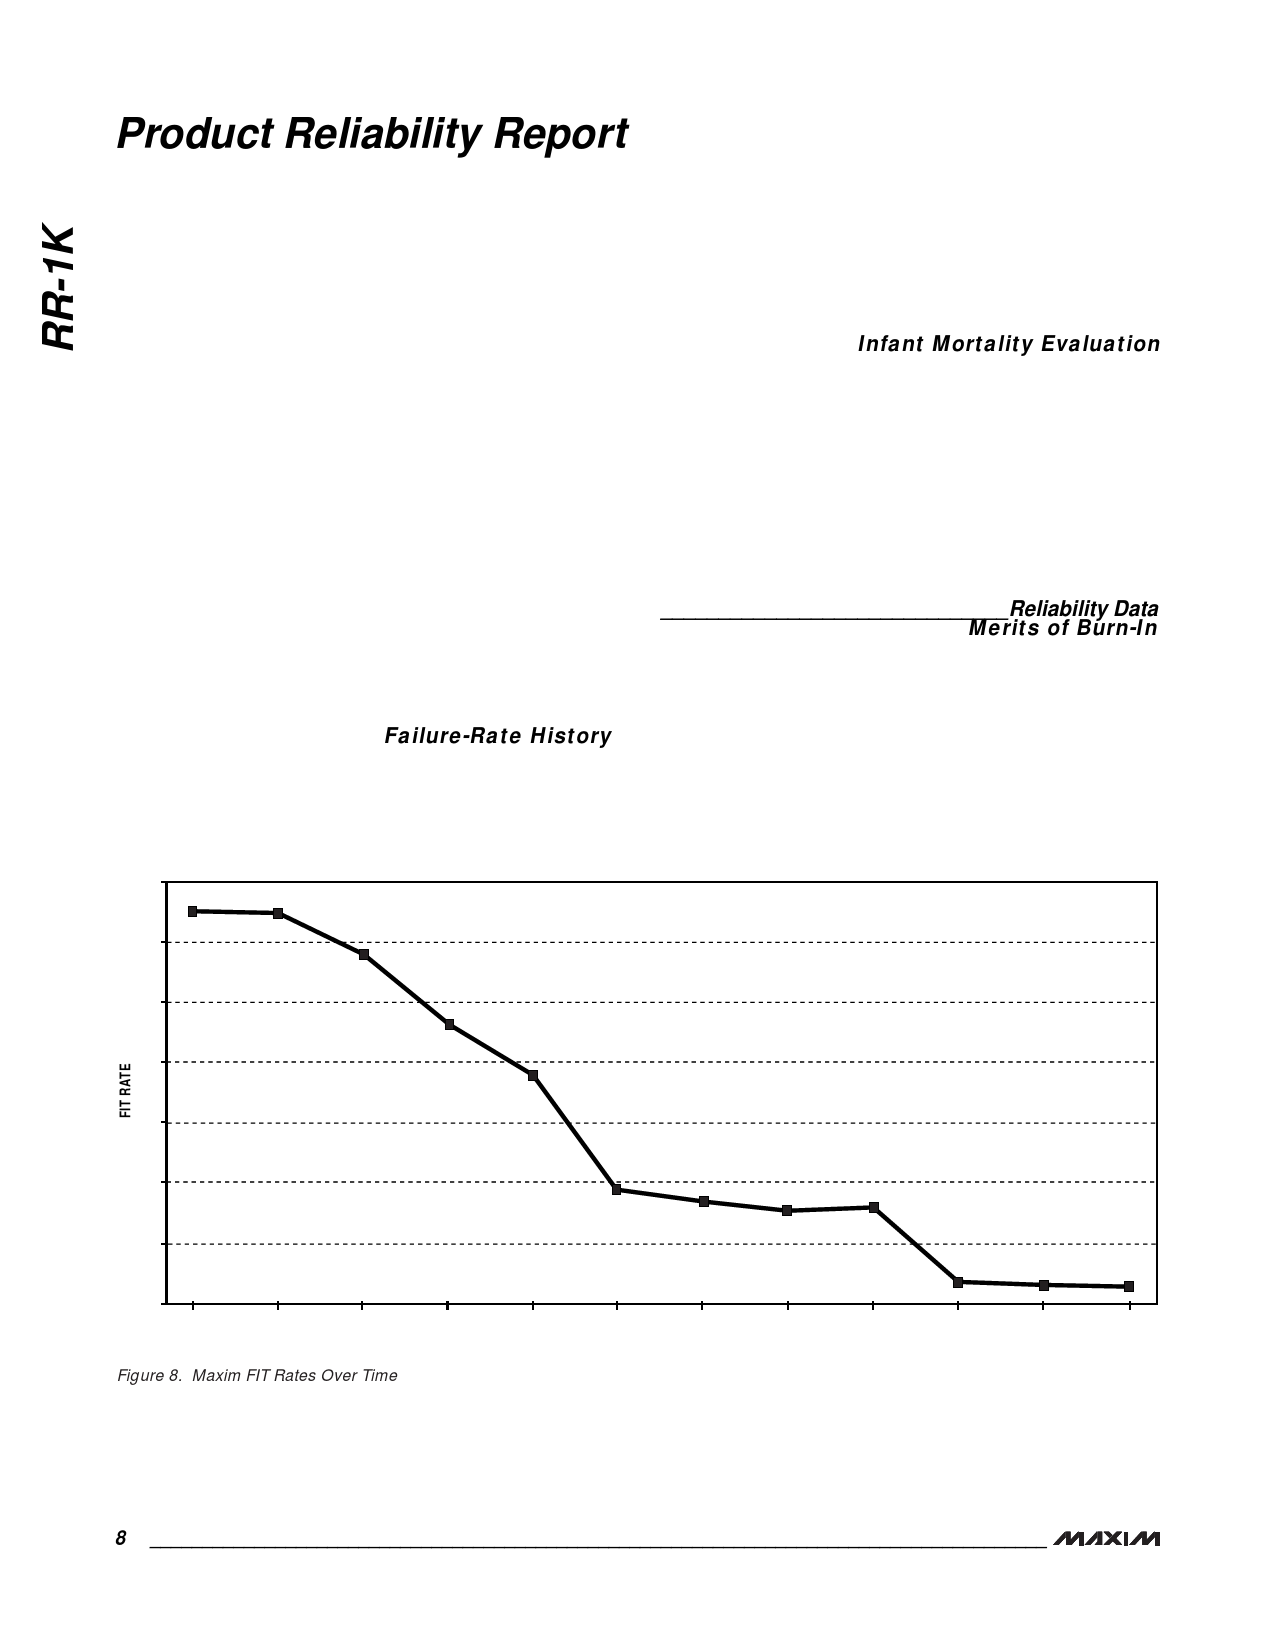
Failure-Rate History
The graph below (Figure 8) illustrates Maxim’s
Failures-in-Time (FIT) rate performance. It also
highlights the progressive improvements made in
this FIT rate, a trend that we expect to see contin-
ue, thanks to our established continuous-improve-
ment methodology.
Infant Mortality Evaluation
Maxim evaluates each process and product family’s
Infant Mortality rate immediately after achieving
qualified status. Through Infant Mortality analysis, we
can identify the common defects for each process or
product family. For an illustration of Maxim’s low
Infant Mortality rate, refer to Table 2. Figure 9 is an
Infant Mortality pareto chart showing each category
of failures; categories are prioritized based on rela-
tive frequency.
______________________________Reliability Data
Merits of Burn-In
Figure 10 plots Failure Rate versus Time for the
metal-gate CMOS process. The plot is based on
Table 3’s Life Test data and Table 2’s Infant Mortality
evaluation data, both applied to a General Reliability
model. From this data, the benefit of production
burn-in can be derived.
8
7.52
7
6
5
4
7.49
6.80
5.63
4.79
3
2.88
2.68
2
1
Sept '85
May '86
July '87
April '88
Mar '90
Mar '91
Jan '92
Figure 8. Maxim FIT Rates Over Time
2.47
Jan '93
2.51
Jan '94
1.31
Jan '95
1.29
Jan '96
1.25
Jan '97
8 ______________________________________________________________________________________
Share Link: 