AN246 데이터 시트보기 (PDF) - Philips Electronics
부품명
상세내역
제조사
AN246 Datasheet PDF : 13 Pages
| |||
Philips Semiconductors
Transmission lines and terminations
with Philips Logic families
Application Note
AN246
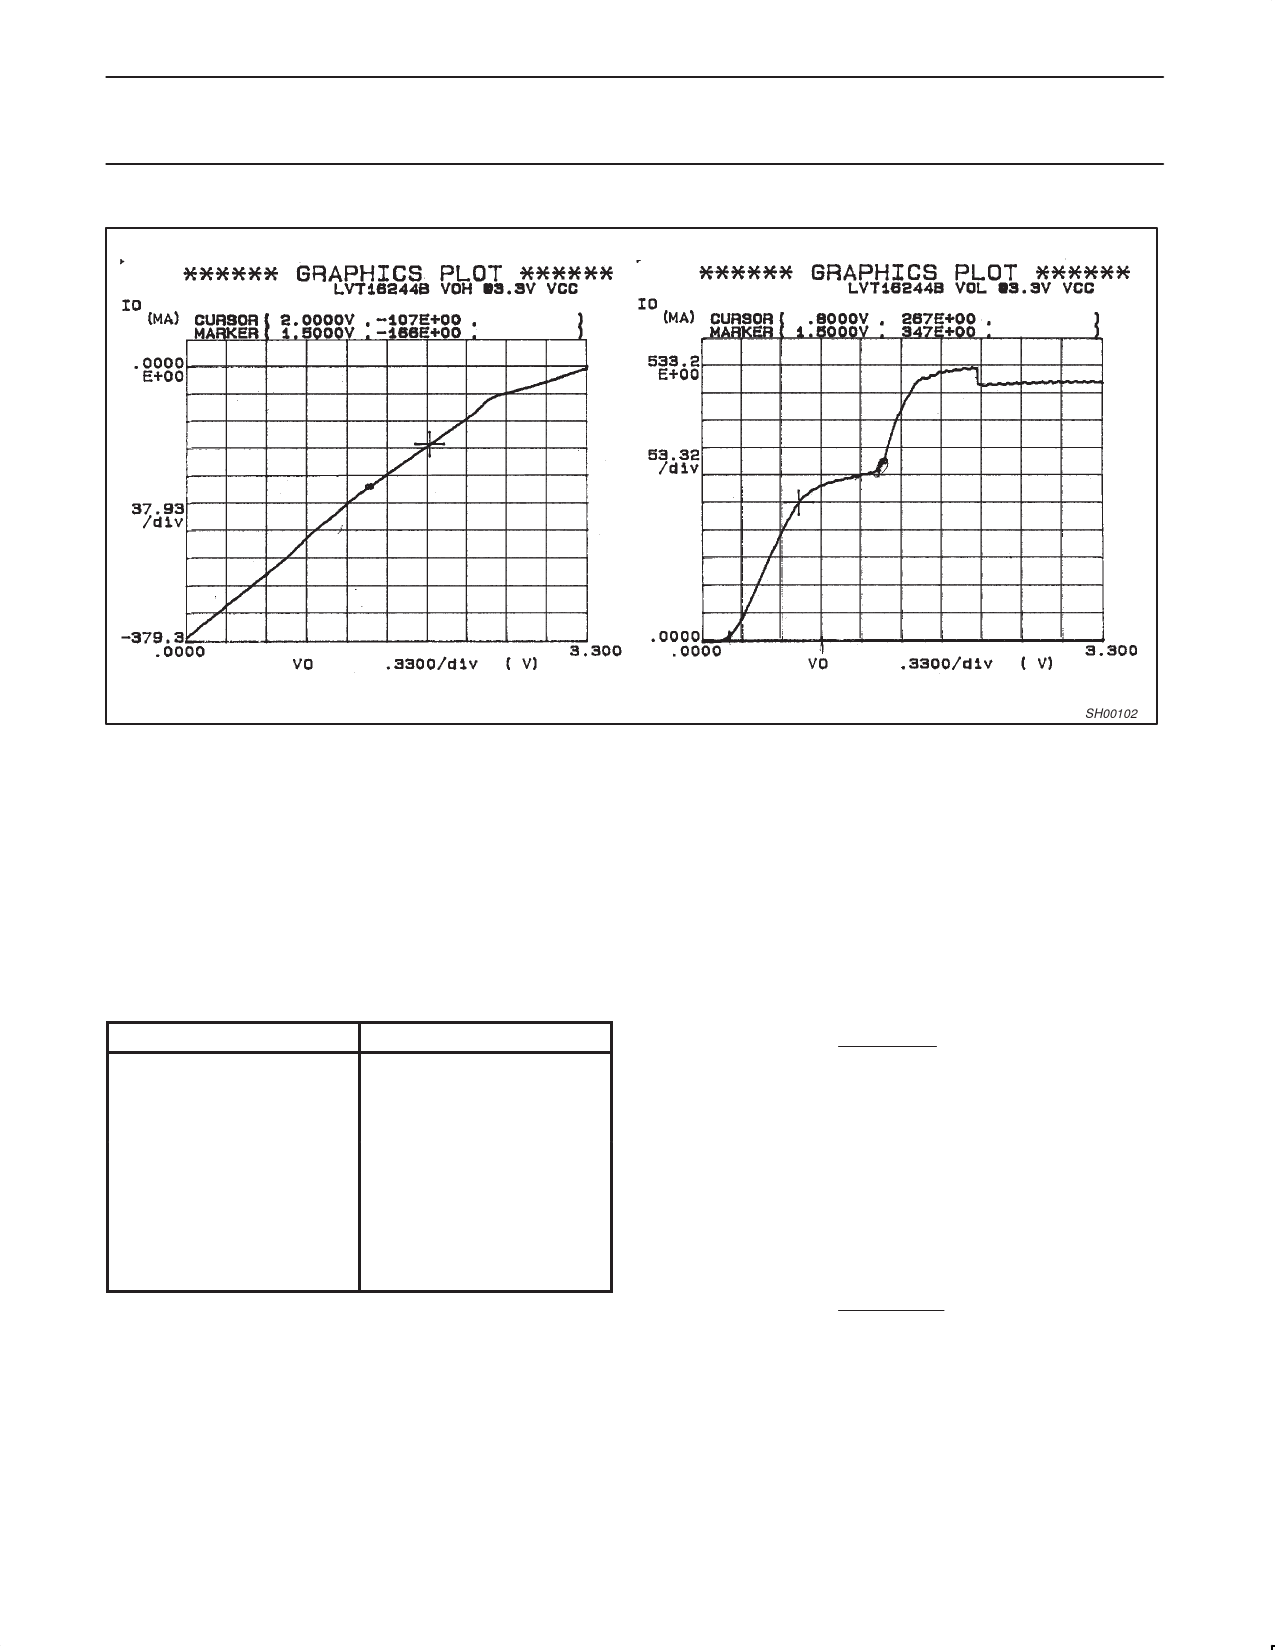
Figure 9. LVT16244 I-V curves
SH00102
Based on the I-V curves, all families have good drive current in the
logic high state, and ABT(16), ALVT, and LVT(16) BiCMOS families
have considerably stronger drive than the other families in the logic
low state. The BiCMOS families have been optimized to drive
backplanes. The other CMOS families are suitable for local buses
and driving point-to-point loads. The following table shows
recommended minimum line impedances that can be driven by the
buffer/drivers of various Philips logic families:
Table 2. Minimum line impedance for logic
families
Logic Family
Minimum ZO
ABT(16)
35 Ω
AC/ACT
50 Ω
ALS(–1)
65 Ω
FAST
50 Ω
LVT(16)
35 Ω
ALVT
35 Ω
LVC(16)
50 Ω
ALVC
50 Ω
REFLECTIONS FROM IMPEDANCE MISMATCHES
Since a driver has non-zero output impedance, its impedance along
with the line impedance form a voltage divider. The incident wave
launched down the line is a portion of the driver’s voltage. When the
wave encounters an impedance change from either the line or a
receiver input, a portion of the wave is reflected back towards the
driver (Vreflected) which is determined by the reflection coefficient r.
The reflected portion is also added to the incident wave which
continues propagating down the line (Vtransmitted). The relationship
of these voltages are shown in the following equations:
Eq. 8
ò
+
(Zload
(Zload
*
)
ZO)
ZO)
Eq. 9
Vreflected + Vincident
ò
Eq. 10
Vtransmitted + Vincident ) Vreflected
Since driver and line impedances are usually mismatched, a
reflection occurs at the driver and travels back towards the load.
The reflection coefficient at the driver is determined by Equation 11:
Eq. 11
ò
+
(Zdriver
(Zdriver
*
)
ZO)
ZO)
This volley of wave reflections continues, with reflections getting
smaller as the signal waveform settles.
During the reflection period, the waveform may have a stairstep
response––in the case of a driver’s impedance higher than the
line’s––or it may have a “ringy” response––in the case of a driver’s
impedance lower than the line’s. To predict the signal integrity of a
waveform you can use reflection charts or Bergeron plots, but they
can be cumbersome.
1998 Feb 05
7
Share Link: 