TDA1526 데이터 시트보기 (PDF) - Philips Electronics
부품명
상세내역
제조사
TDA1526 Datasheet PDF : 14 Pages
| |||
Philips Semiconductors
Stereo-tone/volume control circuit
Product specification
TDA1526
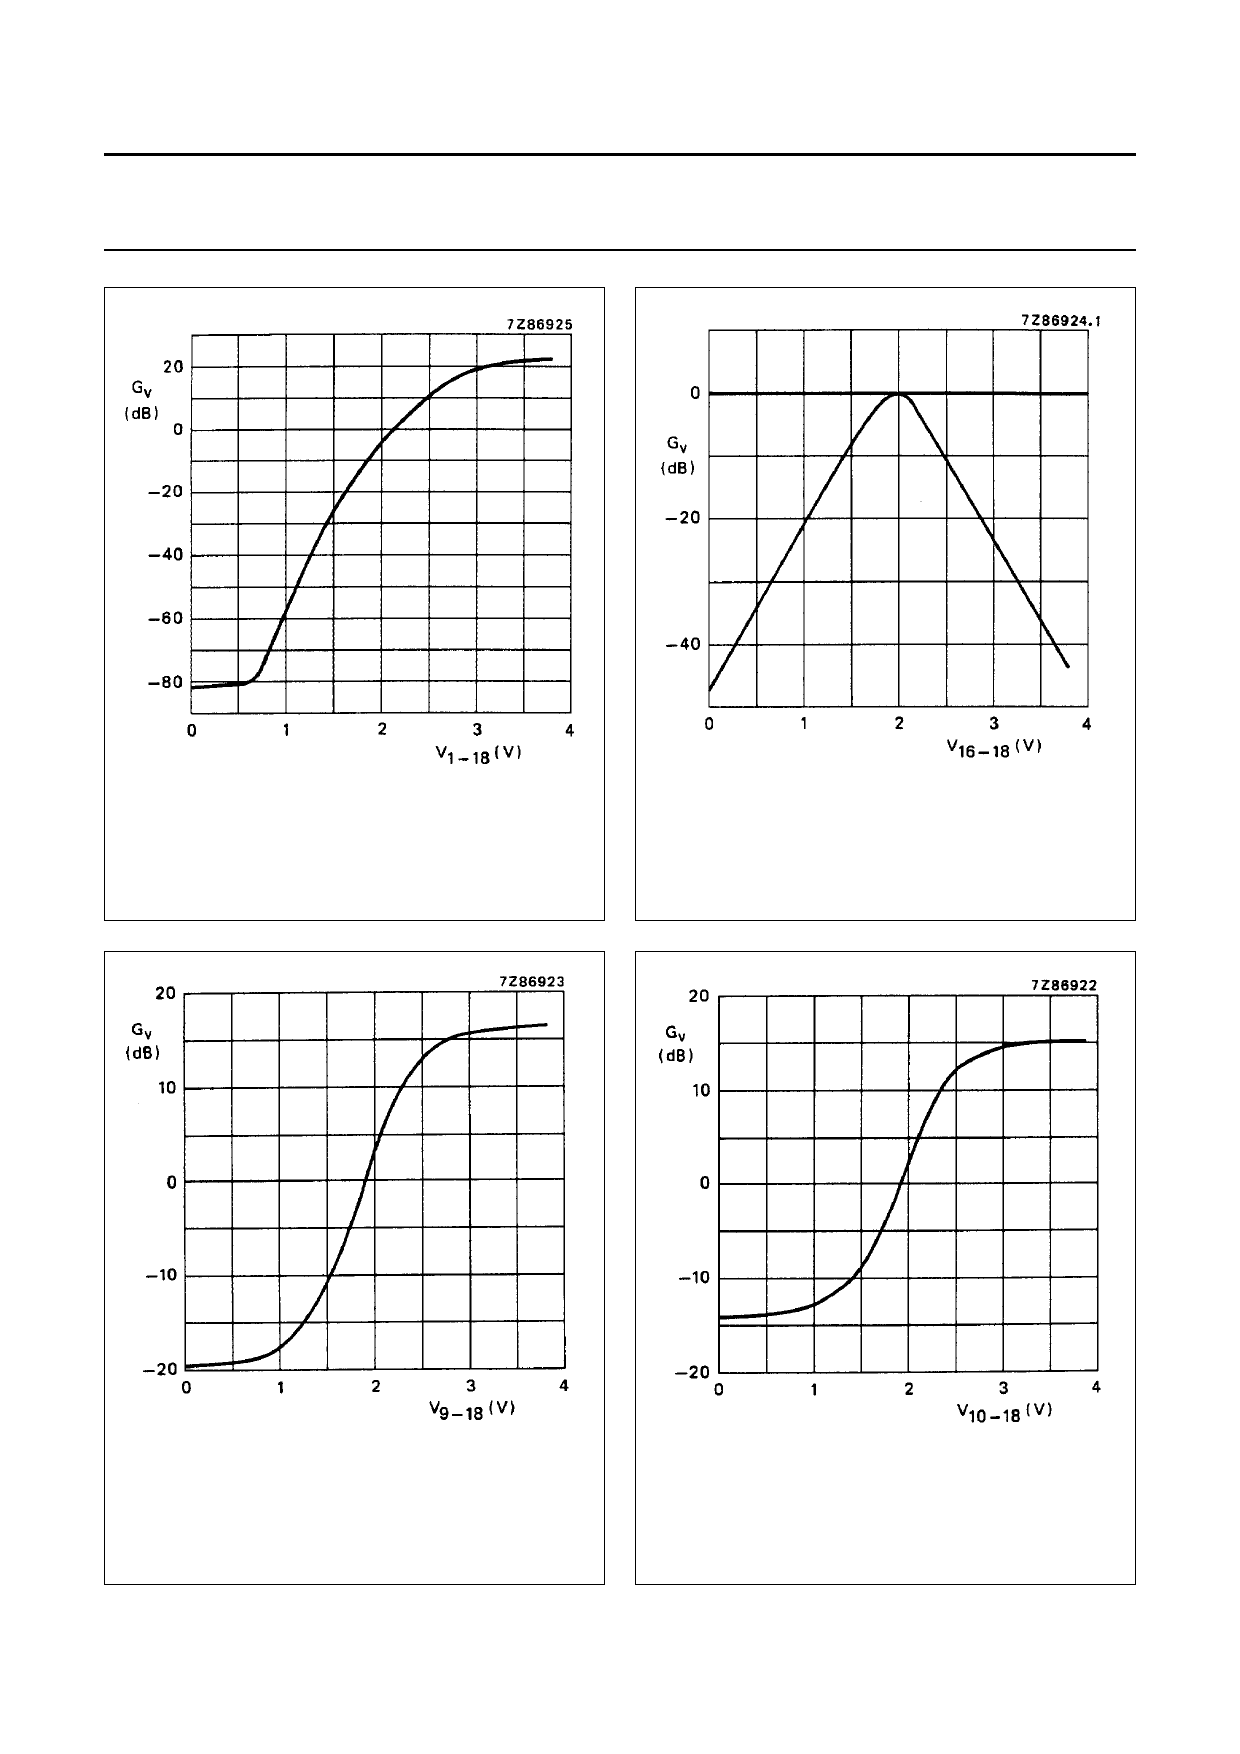
Fig.4
Volume control curve; voltage gain (Gv) as
a function of control voltage (V1-18).
Measured in Fig.1 (internal potentiometer
supply from pin 17 used); VP = 8.5 V;
f = 1 kHz.
Fig.5
Balance control curve; voltage gain (Gv) as
a function of control voltage (V16-18).
Measured in Fig.1 (internal potentiometer
supply from pin 17 used); VP = 8.5 V.
Fig.6
Bass control curve; voltage gain (Gv) as a
function of control voltage (V9-18).
Measured in Fig.1 with single-pole filter
(internal potentiometer supply from pin 17
used); VP = 8.5 V; f = 40 Hz.
May 1992
Fig.7
Treble control curve; voltage gain (Gv) as a
function of control voltage (V10-18).
Measured in Fig.1 (internal potentiometer
supply from pin 17 used); VP = 8.5 V;
f = 16 kHz.
8
Share Link: 