TDA1526 데이터 시트보기 (PDF) - Philips Electronics
부품명
상세내역
제조사
TDA1526 Datasheet PDF : 14 Pages
| |||
Philips Semiconductors
Stereo-tone/volume control circuit
Product specification
TDA1526
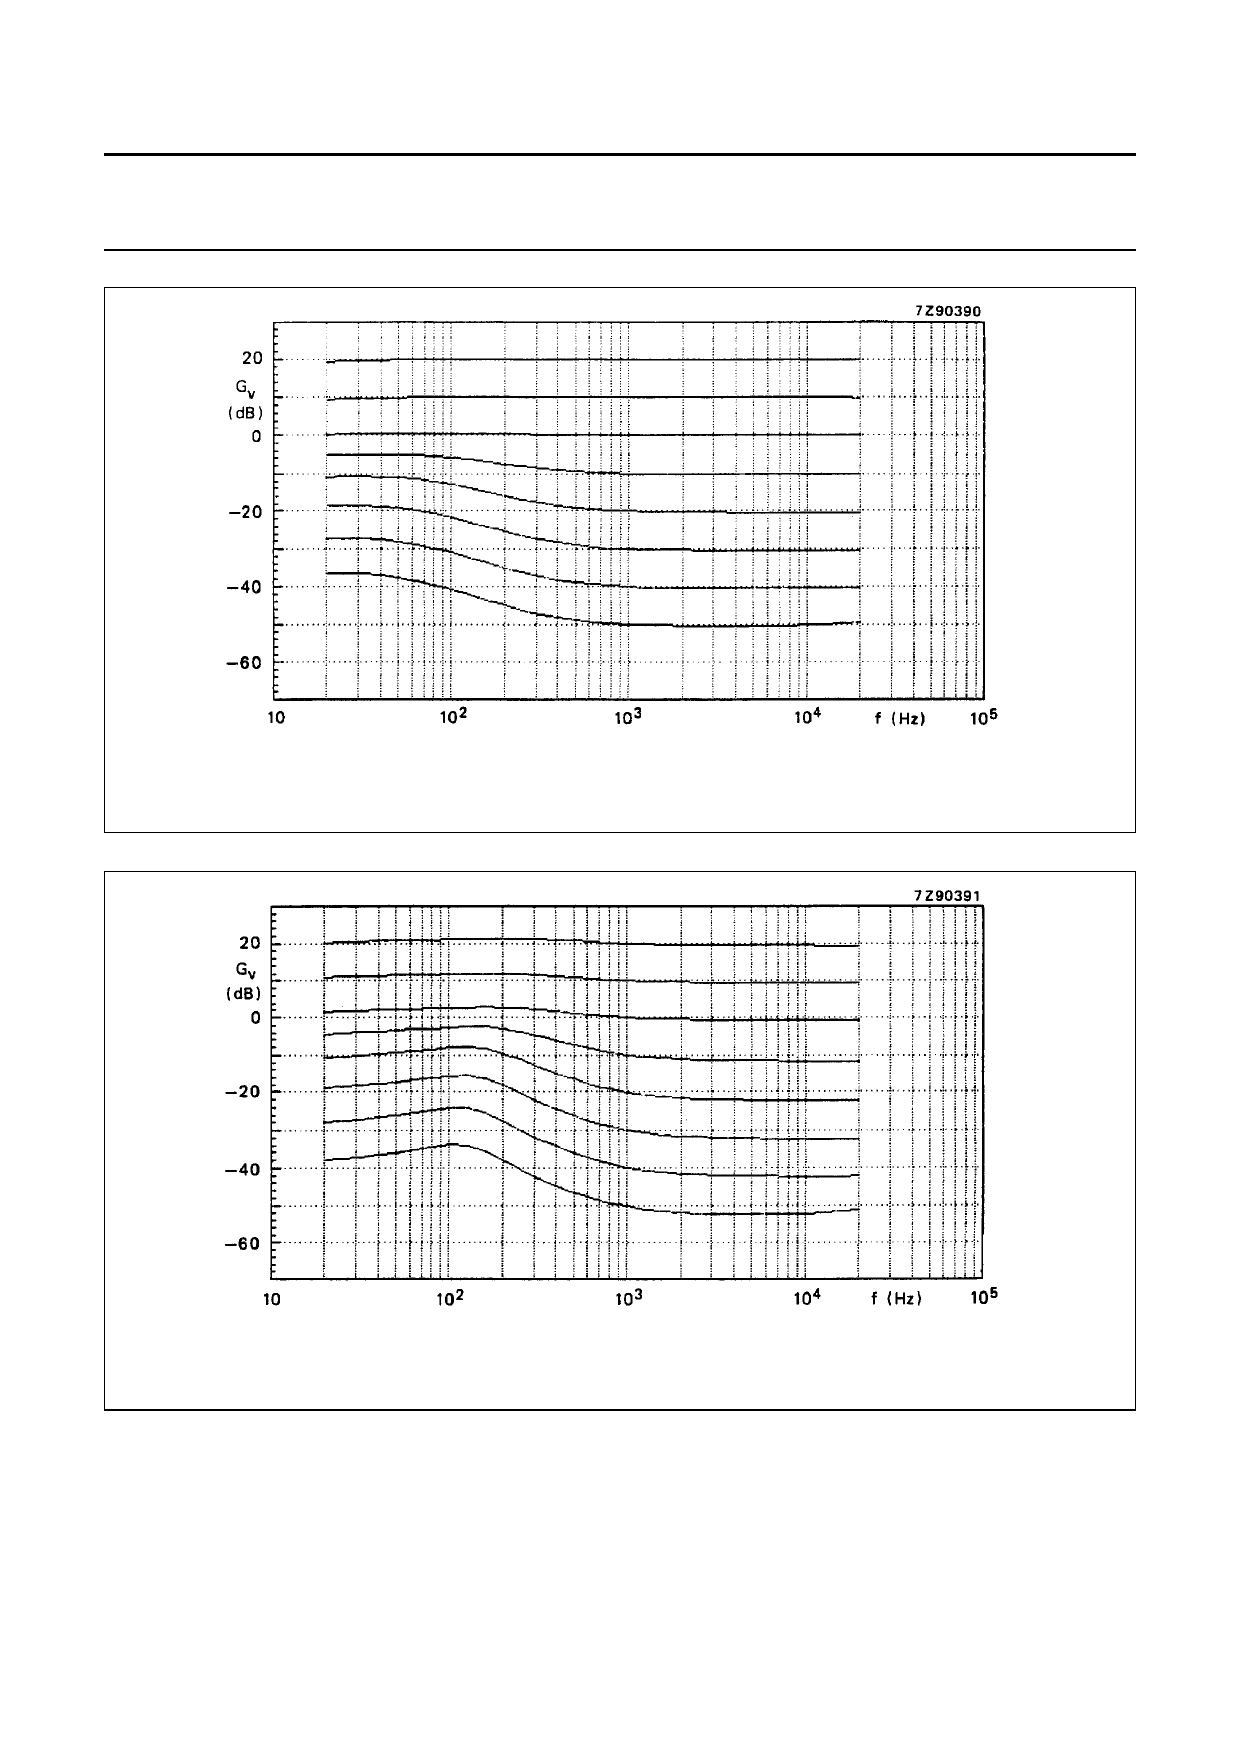
Fig.8 Contour frequency response curves; voltage gain (Gv) as a function of audio input frequency.
Measured in Fig.1 with single-pole filter; VP = 8.5 V.
Fig.9 Contour frequency response curves; voltage gain (Gv) as a function of audio input frequency.
Measured in Fig.1 with double-pole filter; VP = 8.5 V.
May 1992
9
Share Link: 